Introduction
Learning multiplication can feel overwhelming, but the right tools make all the difference. A multiplication chart 1-50 serves as both a learning aid and reference guide, helping students build confidence with numbers while developing essential math skills.
Whether you’re a parent supporting your child’s education, a teacher looking for classroom resources, or a student wanting to strengthen your math foundation, understanding how to use multiplication charts effectively can transform the learning experience. These visual tools don’t just show answers—they reveal patterns, relationships, and shortcuts that make math more intuitive.
This guide explores everything you need to know about multiplication charts covering numbers 1 through 50, from reading techniques to creative applications that extend far beyond the classroom.
What Are Multiplication Charts?
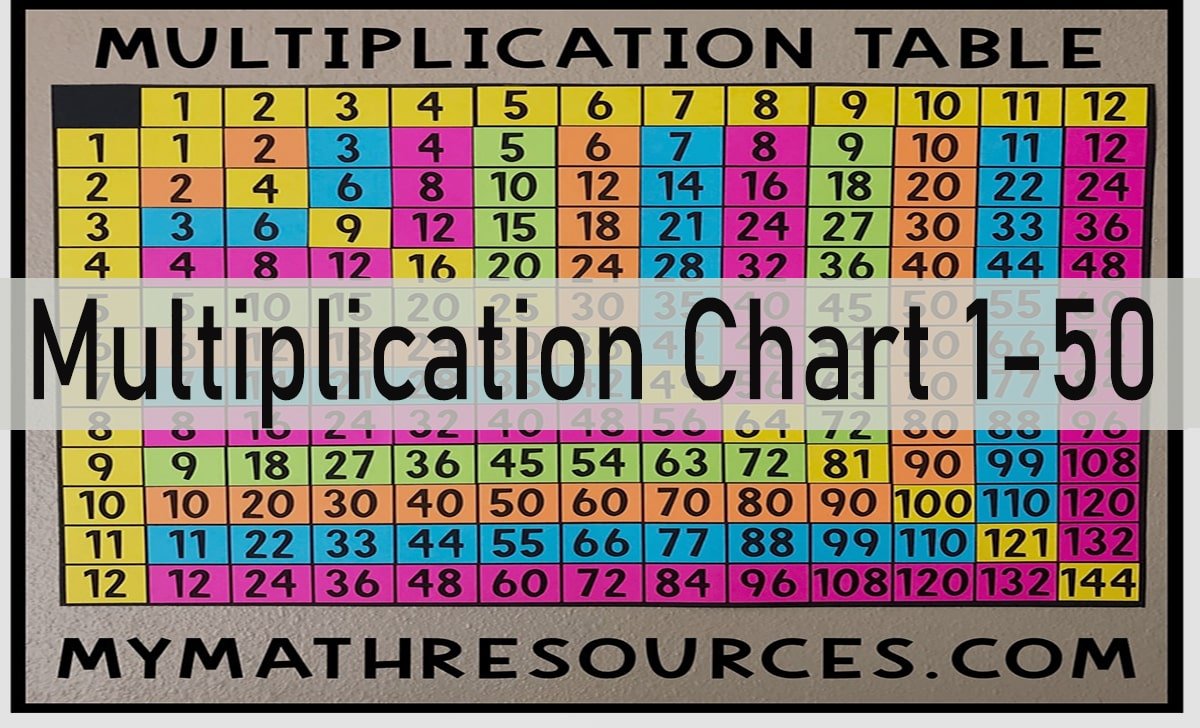
A multiplication chart 1-50 displays the products of multiplying numbers from 1 to 50 in an organized grid format. The first row and column typically show the numbers being multiplied, while the intersecting cells reveal the products.
These charts serve multiple purposes in mathematical education. They provide quick reference for multiplication facts, help students identify number patterns, and offer visual representation of mathematical relationships. Unlike memorization alone, charts allow learners to see how numbers connect and interact.
The format makes complex calculations more manageable. Instead of struggling to remember that 47 × 23 equals 1,081, students can locate the intersection and find the answer instantly. This immediate feedback builds confidence and reduces math anxiety.
Benefits of Using Charts 1-50
Multiplication charts covering 1-50 offer significant advantages over smaller ranges. This extended scope prepares students for real-world calculations they’ll encounter in advanced math, science, and everyday situations.
Pattern Recognition
Extended charts reveal mathematical patterns that smaller grids miss. Students notice how multiples of 5 always end in 0 or 5, how even numbers multiplied together always produce even results, and how certain number combinations create predictable sequences. These observations develop mathematical intuition that serves students throughout their academic careers.
Reduced Calculation Time
Having products readily available eliminates the need for repeated addition or mental calculation during problem-solving. This efficiency allows students to focus on higher-level thinking rather than getting stuck on basic arithmetic.
Foundation for Advanced Concepts
Charts 1-50 introduce students to larger numbers they’ll encounter in algebra, geometry, and beyond. Early exposure to these products makes transitions to advanced math smoother and less intimidating.
Real-World Relevance
Many practical applications require multiplication within the 1-50 range. Calculating areas, determining quantities for recipes, or figuring out costs for multiple items all benefit from familiarity with these products.
How to Read a Multiplication Chart
Reading a multiplication chart requires understanding its grid structure. Numbers along the top row represent one factor, while numbers in the first column represent the second factor. The product appears where the corresponding row and column intersect.
To find 8 × 6, locate 8 in either the top row or left column, then trace across or down to where it meets 6. The intersection shows 48, which is the product.
Most charts use a symmetrical layout, meaning 8 × 6 and 6 × 8 appear in different locations but show the same result. This symmetry reinforces the commutative property of multiplication—the order of factors doesn’t change the product.
Color Coding and Visual Aids
Many multiplication charts use color coding to highlight patterns or group related information. Multiples of 10 might appear in blue, while perfect squares use yellow highlighting. These visual cues help students spot relationships more quickly.
Using Charts for Division
Charts work in reverse for division problems. To solve 72 ÷ 9, find 72 in the chart’s interior, then trace back to the row and column headers to identify the factors: 8 and 9.
Tips for Memorizing Multiplication Facts
While charts provide instant answers, memorizing key multiplication facts increases mathematical fluency and speed. Strategic approaches make memorization more effective and less tedious.
Start with Easier Facts
Begin with multiples of 1, 2, 5, and 10, as these follow clear patterns. Multiples of 1 remain unchanged, multiples of 2 are even numbers, multiples of 5 end in 0 or 5, and multiples of 10 simply add a zero.
Focus on Fact Families
Group related facts together for more efficient learning. The fact family for 6, 7, and 42 includes 6 × 7 = 42, 7 × 6 = 42, 42 ÷ 6 = 7, and 42 ÷ 7 = 6. Learning these connections strengthens understanding.
Use Skip Counting
Practice skip counting by different numbers to internalize multiplication patterns. Counting by 3s (3, 6, 9, 12, 15) reinforces the 3 times table, while counting by 7s builds familiarity with those products.
Apply the Doubling Strategy
For facts involving 4, double the answer for the corresponding 2 times table fact. Since 2 × 8 = 16, then 4 × 8 = 32 (double 16). This strategy reduces the number of new facts to memorize.
Practice Square Numbers
Perfect squares (numbers multiplied by themselves) appear frequently in mathematics. Focus extra attention on products like 6 × 6 = 36, 7 × 7 = 49, and 8 × 8 = 64.
Creative Ways to Use Charts in Daily Life
Multiplication charts extend beyond academic settings into practical applications that make math relevant and engaging.
Cooking and Baking
Recipe modifications require multiplication skills. Doubling a recipe for 8 people when the original serves 4, or calculating ingredient amounts for larger gatherings, becomes simpler with chart reference.
Shopping and Budgeting
Comparing prices, calculating bulk purchase savings, or determining total costs for multiple items all benefit from quick multiplication access. Charts help verify mental calculations and catch errors.
Home Improvement Projects
Calculating square footage for flooring, determining paint coverage for walls, or figuring material quantities for DIY projects requires multiplication within the 1-50 range frequently.
Sports and Statistics
Understanding batting averages, calculating team statistics, or tracking personal fitness metrics often involves multiplication. Charts make these calculations accessible to younger sports enthusiasts.
Games and Puzzles
Many board games, card games, and puzzles incorporate multiplication elements. Having chart familiarity gives players advantages and makes games more enjoyable.
Frequently Asked Questions
How long does it take to memorize multiplication facts 1-50?
Memorization timelines vary significantly based on practice frequency, learning style, and individual aptitude. Most students need 3-6 months of regular practice to achieve fluency with facts through 12, while extending to 50 may take additional time. Consistent daily practice produces better results than intensive cramming sessions.
Should I use digital or printed multiplication charts?
Both formats offer unique advantages. Printed charts provide tactile learning experiences and remain accessible without technology. Digital versions often include interactive features, color coding, and audio support. Many educators recommend using both types to accommodate different learning preferences.
At what age should children start using multiplication charts 1-50?
Most students encounter multiplication charts around ages 7-9, typically in second or third grade. However, readiness depends more on mathematical development than age. Children should be comfortable with addition and subtraction before tackling multiplication concepts.
Can multiplication charts replace memorization entirely?
Charts serve as excellent learning tools and references, but they cannot completely replace memorization. Mathematical fluency requires instant recall of basic facts for efficient problem-solving. Charts should supplement, not substitute for, memorization efforts.
How do I help a struggling student use multiplication charts effectively?
Start with smaller chart sections focusing on easier facts. Use physical manipulatives alongside charts to reinforce concepts. Incorporate games, songs, and visual aids to make learning more engaging. Celebrate small victories to build confidence gradually.
Building Mathematical Confidence Through Visual Learning
Multiplication charts 1-50 provide more than quick reference—they offer pathways to mathematical understanding and confidence. These tools reveal the logical structure underlying multiplication while making complex calculations accessible to learners at all levels.
Success with multiplication charts comes through consistent use, pattern recognition, and gradual progression from reference tool to internalized knowledge. Whether supporting a child’s homework, teaching classroom lessons, or refreshing your own mathematical skills, these charts serve as reliable companions on the journey toward numerical fluency.
Start incorporating a multiplication chart 1-50 into your regular math practice. Begin with familiar facts, explore interesting patterns, and gradually expand your comfort zone with larger numbers. With time and practice, what once seemed challenging will become second nature.