Introduction
Spark architecture can sound complex at first. This guide explains it in plain, simple words. We use short sentences and clear examples. You will learn how Spark runs code across many machines. You will meet the driver, executors, and cluster managers. We will explain RDDs, DataFrames, and Spark SQL. You will see how memory, shuffles, and partitions matter. We will cover streaming and machine learning features too. The goal is practical understanding you can apply quickly. Many teams use Spark for fast data processing jobs. Good design cuts costs and makes pipelines reliable. Let us begin our tour of spark architecture now.
What is Spark Architecture?
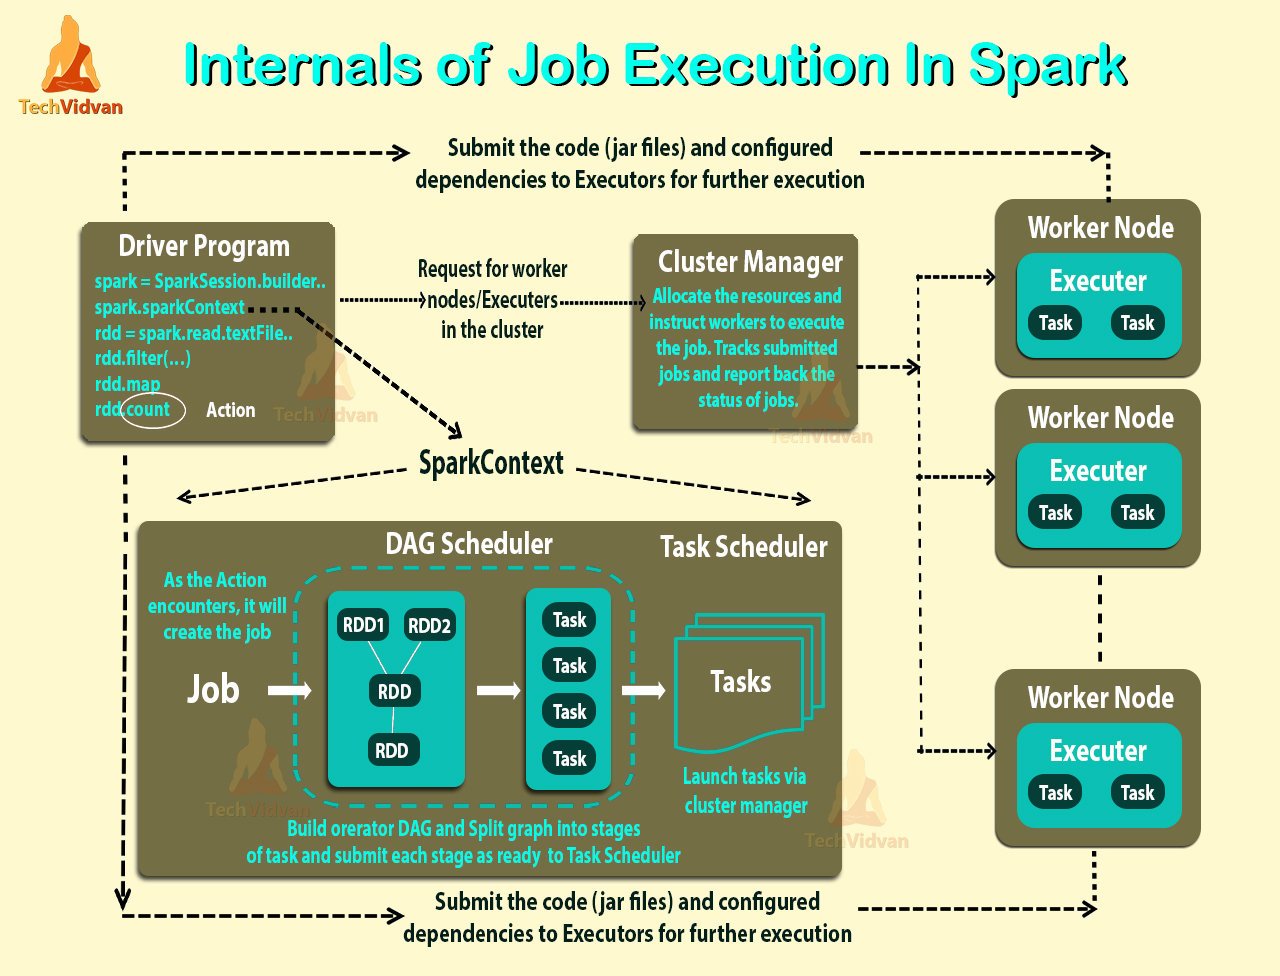
Spark architecture is the map of how Spark runs jobs. It shows how code becomes tasks on worker nodes. The driver plans work and executors do the work. A cluster manager assigns machines and resources to Spark. This architecture supports batch, interactive, and streaming workloads. It also defines how data moves and how failures are handled. Knowing this helps you reduce costly network transfers. It also helps you pick storage and partitioning strategies. Spark often reads from HDFS, S3, or cloud object storage. Design choices influence cost, throughput, and latency in production. Clear mental models speed debugging and optimization work. Keep these ideas in mind while you learn more.
Core Components: Driver and Executors
The driver is the central coordinator for a Spark app. It builds the execution plan and talks to the cluster manager. Executors run tasks, hold cached data, and report metrics. Each executor has CPU cores and a memory allocation. The driver sends tasks to executors based on the DAG plan. Executors run in parallel across many nodes in the cluster. If an executor dies, the driver reschedules its tasks. Tuning executor size affects parallelism and memory pressure. Too small executors cause many slow tasks and overhead. Too large ones may waste resources and slow scheduling decisions. Understanding driver and executor roles helps resource planning. This split is a key part of spark architecture.
Cluster Managers and Deployment Modes
Cluster managers allocate machines and launch executors for Spark. Popular managers include YARN, Mesos, Kubernetes, and Standalone mode. YARN integrates neatly with Hadoop ecosystems in many organizations. Kubernetes is popular for containerized, cloud native deployments. Standalone mode is simple and works well for small clusters. Deployment choice affects logging, networking, and security considerations. Client mode runs the driver outside the cluster for debugging. Cluster mode runs the driver inside the cluster for production jobs. Pick the manager that matches your infrastructure and operational needs. Your choice shapes how you operate and monitor Spark jobs. Understanding managers helps you design a stable spark cluster. These choices influence the overall spark architecture for teams.
Resilient Distributed Datasets (RDDs)
RDDs stand for Resilient Distributed Datasets inside Spark. They are partitioned collections of objects across worker nodes. RDDs are immutable and built by applying transformations lazily. Lineage records let Spark recompute lost partitions after failures. RDDs offer fine control for custom partition-level logic and code. They do not benefit from SQL style query optimizations automatically. Use RDDs when DataFrame APIs do not express required transformations. RDDs help you reason about low level task execution and locality. Knowing RDDs makes higher level APIs easier to understand and use. They are useful for complex or unstructured data transformations. Engineers often use them for edge cases and special logic. RDD knowledge contributes to a deeper spark architecture view.
DataFrames and Spark SQL
DataFrames are table-like structures with named columns and types. They carry schema which helps the optimizer plan execution. Spark SQL allows writing queries in familiar SQL syntax easily. The Catalyst optimizer rewrites and optimizes query plans automatically. DataFrames often use code generation for faster execution in Tungsten. They can read and write Parquet, JSON, CSV, and more formats. DataFrames are usually faster and simpler than raw RDD code. Use DataFrames for analytics, reporting, and ETL tasks when possible. They fit nicely into modern data pipelines and BI workflows. Adopting DataFrames helps teams write clearer and faster jobs. This API is a central part of modern spark architecture. Keep schemas consistent to avoid runtime surprises or errors.
DAG Scheduler and Task Execution
Spark converts job code into a Directed Acyclic Graph or DAG. The DAG divides work into stages separated by shuffle boundaries. The scheduler maps stages into tasks and sends them to executors. Tasks operate on partitions and often try to run locally to data. Shuffles create stage boundaries where data moves across nodes. The DAG view helps spot which parts cause long delays or waits. Reducing stage boundaries often reduces expensive shuffle and I/O work. You can inspect the DAG in the Spark UI for debugging help. Understanding scheduling makes it easier to reason about performance. This scheduler and task model defines runtime behavior in Spark. It is a central runtime element of the spark architecture concept. Good DAG design reduces runtime cost and improves predictability.
Memory Management and Caching
Memory is a leading factor in Spark performance and failures. Executors split memory between execution and storage needs to avoid conflict. Caching keeps hot datasets in memory to avoid recompute and disk I/O. But caching consumes RAM and may force spills or eviction under pressure. Tungsten and off-heap memory reduce Java garbage collection overhead. Choosing Kryo over Java serialization often speeds network transfers. Tune memory fractions to balance execution buffers and cached data. Watch for frequent GC pauses in executor logs as a sign of trouble. Proper memory tuning makes jobs faster and more stable in production. Monitoring memory usage is essential for healthy clusters and jobs. Memory strategy plays a crucial role in spark architecture performance. Plan memory with the workload and node sizes in mind always.
Partitioning and Data Locality
Partitioning determines how data is split across worker nodes. Balanced partitions help use cluster CPUs and avoid hotspots. Data locality means tasks run where the data lives, reducing network cost. Local reads are faster than remote reads across the network. Co-partitioning related datasets avoids shuffles and makes joins faster. Avoid too many tiny partitions that cause scheduler overhead and delays. Avoid very few large partitions that limit parallelism and throughput. Repartition and coalesce let you change parallelism before heavy steps. Good partition keys reflect join keys and natural data distribution. Partition design directly impacts shuffle volume and task time in practice. A smart partition plan helps the efficiency of spark architecture. Test partition strategies with realistic data sizes and queries first.
Shuffles and Optimizations
Shuffles move data between nodes for grouping, sorting, or joining. Shuffles involve disk I/O, network transfer, and CPU for sorting and merging. Map-side combine reduces the amount of data that goes into the shuffle. Broadcast joins avoid shuffles when one table is small enough to fit memory. Tune spark.sql.shuffle.partitions to match your cluster’s total cores. Shuffle compression reduces bytes at the cost of extra CPU for compression. Monitor shuffle read and write sizes in the Spark UI to find issues. Design queries and partitioning to minimize heavy shuffle steps in jobs. Reducing shuffle is one of the best levers to make jobs faster. Many optimizations focus on lowering shuffle volume and improving locality. Optimize shuffles to save both time and cluster network resources. A low-shuffle design benefits the whole spark architecture greatly.
Spark Streaming and Structured Streaming
Structured Streaming treats streams as unbounded DataFrames you can query. It offers familiar DataFrame APIs for both batch and streaming logic. Behind the scenes it runs micro-batches or continuous processing modes. Stateful streaming operations need checkpoints to recover state after failures. Watermarks help manage and drop late-arriving events safely in windows. Streaming reuses many batch primitives which simplifies testing and reuse. You should design idempotent sinks to handle retries and duplicates safely. Exactly-once semantics depend on the sink and the processing guarantees in use. Streaming integrates with the same Spark runtime and scheduling model as batch. This allows teams to share tooling and expertise across job types. Structured Streaming fits into common production data architectures easily. Plan checkpoints and offsets to meet fault tolerance needs and latency goals.
MLlib and Machine Learning Pipelines
MLlib provides distributed algorithms for classification and clustering. It also includes utilities for feature extraction and transformation. Pipelines help chain preprocessing and model stages together cleanly. Feature engineering often runs across many partitions on executor nodes. Training can be parallelized to speed model fitting on large datasets. Model evaluation uses holdout data or cross validation to avoid overfitting. Model serving is often moved to a separate low latency system. Use registries and versioning tools to manage models in production. ML parts slot naturally into ETL and batch pipelines for many teams. Resource planning for ML jobs must consider memory and CPU needs. ML workflows fit into the broader spark architecture of data flow. Design experiments and tracking from the start to aid reproducibility.
Monitoring, Spark UI, and Debugging
Spark UI shows stages, task timelines, and storage metrics in one place. Use the UI to identify slow stages and task stragglers quickly. Executor logs contain GC messages and stack traces for runtime errors. Collect metrics with Prometheus or a monitoring system for longer term analysis. Event logs and history servers let you replay and profile older jobs. Good logging and metrics let you detect regressions before they harm users. Observability helps teams find skew, memory pressure, and heavy shuffle spots. Alerts can notify engineers when jobs exceed latency or resource thresholds. Plan for centralized log storage and access for debugging production runs. Monitoring provides the feedback loop to continuously improve pipelines. Reliable monitoring is a vital part of running spark architecture in production. Treat observability as part of design, not just an afterthought.
Best Practices for Designing Spark Applications
Start with a small prototype and realistic test data for main flows. Prefer DataFrames and SQL for clarity and for optimizer benefits. Keep transformations modular and test them with unit tests and samples. Use broadcast joins when one side is small to remove shuffles. Only cache datasets with clear repeat usage and enough memory to hold them. Set executor memory and cores to match node resources and job patterns. Use CI and deployment pipelines to run jobs against staging data automatically. Document schemas, assumptions, and expected data shapes for future maintainers. Automate alerting and performance regression checks to catch problems early. Following these practices improves reliability and team velocity over time. Apply these rules when you design and operate any spark architecture. Good processes are as important as technical tuning for real success.
Real-world Example: A Simple ETL Pipeline
Imagine a pipeline that ingests web logs every hour into a lake. A Spark job reads raw files and parses lines into typed columns. It filters invalid rows and enriches with geo and user data lookups. A small dimension table is broadcast to avoid heavy shuffle during join. DataFrames validate schema and write partitioned Parquet files for storage. Downstream jobs read partitions and compute daily aggregates and reports. Streaming ingestion can replace hourly batches for near real time insights. This example connects abstract components to real engineering steps clearly. Teams use similar patterns for ETL, analytics, and reporting workloads. Seeing a concrete flow helps you map concepts to code and infra quickly. This simple pipeline shows practical elements of spark architecture. Try building a small version to learn the parts and their costs.
Comparison: Spark vs. Hadoop MapReduce
MapReduce uses separate map and reduce phases with many intermediate files. Spark builds a DAG and keeps intermediate data in memory when helpful. This design allows Spark to run many iterative jobs much faster than MapReduce. MapReduce still works where simple, one-pass batch jobs are enough and cheap. Spark offers higher-level APIs like DataFrames that make complex transforms easier. Both systems can run on the same resource managers and storage backends. Choosing between them depends on workload types and team skills available. Spark reshaped how teams think about interactive and iterative big data work. Performance benefits often justify Spark for analytics and machine learning tasks. Understanding differences helps select the right tool for each job. Each tool has a place in modern data engineering landscapes.
Common Tuning Tips and Tricks
Measure first by using the Spark UI and job metrics to find hotspots. Adjust partitions to increase parallelism instead of creating many small tasks. Right-size executors to give enough memory and CPU while avoiding waste. Switch to Kryo serialization to reduce CPU overhead and network bytes. Tune spark.sql.shuffle.partitions to reflect your cluster core count and workload. Fix skewed keys by salting or repartitioning to balance work across tasks. Use caching selectively for datasets that are read many times in a job. Monitor GC pauses and adjust memory settings to reduce long collections. Small measured changes often bring big improvements to job performance. Document tuning steps and track performance before and after changes. Use profiling and incremental tuning as part of your regular maintenance plan. Tuning is ongoing work and needs real metrics and steady iteration.
Conclusion
Spark is a flexible and powerful platform for many data workloads. Understanding drivers, executors, DAGs, and partitioning helps design well. Minimizing shuffle and choosing good partition keys speeds most jobs substantially. Prefer DataFrames for SQL style work and RDDs when you need fine control. Monitor with the Spark UI and central metrics to catch regressions early. Test with realistic data sizes before scaling jobs to production clusters. Automate deployments and include performance checks in your CI pipelines. Good practices and observability make Spark systems reliable and maintainable. Try a small project to practice the ideas and tune with real metrics. Keep learning and join community resources to stay current with improvements. These habits will help you get the most from spark architecture. Thanks for reading ask me to expand any section with diagrams or code!
FAQs
What is the main difference between RDD and DataFrame?
RDDs give low level partition control and direct task handling. DataFrames expose schema and let Spark optimize queries automatically. DataFrames use the Catalyst optimizer to plan efficient execution. Use DataFrames for SQL style analytics and ETL tasks broadly. Use RDDs when you need custom partition-level logic or non-tabular data. Prefer DataFrames for clarity and overall performance in most cases. Testing both approaches on sample data helps choose the right API. Document reasons for using RDD when you pick it for clarity. Keep transformations small and testable to avoid hidden performance issues. Check logs and metrics for more details. Use smaller samples to test potential fixes locally. Document changes so others can follow your steps.
How does Spark recover from executor failure?
Spark tracks lineage to recompute partitions lost when executors fail. If an executor dies, the driver reschedules its tasks elsewhere. Cluster managers may also restart failed executor processes automatically. Checkpointing reduces recompute time for long or stateful pipelines. Write stable offsets and checkpoints for streaming applications to recover state. Use reliable storage so recovery does not lose important data or state. Observability helps you find why executors fail and prevent repeats. Check logs and metrics for more details. Use smaller samples to test potential fixes locally. Document changes so others can follow your steps. Share findings with your team to improve future jobs. Re-test after each tuning step to see the effect.
When should I cache data in Spark?
Cache when the same dataset is used multiple times in a job. Caching avoids repeated computation and heavy disk reads on every action. Only cache datasets that have clear reuse to justify the memory cost. Monitor memory pressure to avoid eviction and out of memory errors. Choose the right storage level like MEMORY_ONLY or MEMORY_AND_DISK. Plan caching as part of your memory and cluster resource strategy. Check logs and metrics for more details about memory behavior. Use smaller samples to test the impact of caching before full runs. Document changes so others can follow your steps and reproduce results. Share findings with your team to improve future jobs. Re-test after each tuning step to see the effect. Keep a record of configuration changes and their outcomes.
What is a shuffle and why is it slow?
A shuffle redistributes data across nodes for grouping and joining. It writes intermediate data and reads it back across the network. Shuffles involve disk I/O, network transfer, and CPU overhead for sorting. Reduce shuffle by pre-aggregating and using map-side combiners where possible. Use broadcast joins when one table is small enough to fit in memory. Good partitioning avoids many expensive shuffle-heavy operations in queries. Check logs and metrics for more details about shuffle I/O. Use smaller samples to test potential fixes locally before applying to full runs. Document changes so others can follow your steps. Share findings with your team to improve pipeline design. Re-test after each tuning step to measure impact. Keep a record of configuration changes and their outcomes.
How do I debug a slow Spark job?
Open the Spark UI to inspect stages and task durations to locate slow parts. Look for skewed tasks and long running stragglers in stages. Check executor logs for garbage collection pauses and exceptions. Measure shuffle read and write sizes to find heavy data movement. Run parts of the job locally with a sample to test fixes quickly. Add metrics and alerts to detect regressions over time and act fast. Check logs and metrics for more details. Use smaller samples to test potential fixes locally. Document changes so others can follow your steps. Share findings with your team to improve future jobs. Re-test after each tuning step to see the effect. Keep a record of configuration changes and their outcomes.
Can Spark run on Kubernetes and why use it?
Yes, Spark runs on Kubernetes and many teams use this setup. Kubernetes orchestrates containers and helps with autoscaling and security. It launches driver and executor pods and manages their lifecycle easily. Using Kubernetes fits cloud native CI/CD and container-based workflows well. Kubernetes integrates with cluster security, namespaces, and resource quotas. Teams adopt Kubernetes to standardize deployments across environments and clouds. Check logs and metrics for more details when running on Kubernetes. Use smaller samples to test potential fixes locally. Document changes so others can follow your steps. Share findings with your team to improve future jobs. Re-test after each tuning step to measure the result. Keep a record of configuration changes and their outcomes.